Daily chemical market prices show sharp volatility across major sectors, led by Carbon Black +18.93%, PVC -12.57%, and Ethyl Acetate +11.50%, amid rising energy costs and uneven downstream demand.GuideView14 MIN READSeptember 11, 2026
Daily Chemical Market Price Overview — September 11, 2026
The latest daily chemical price update highlights significant price movements across major sectors including
Basic Chemicals,
Fine Chemicals,
Energy,
Plastics, and
Rubber. This report summarizes daily, weekly, and monthly price fluctuations to help manufacturers, traders, and procurement professionals track short-term market volatility, upstream cost pressures, and broader pricing trends across the chemical supply chain.
Market focus today centered on sharp gains in
Carbon Black,
Ethyl Acetate, and selected solvents, while
WTI Crude Oil continued to strengthen amid heightened energy supply risks. At the same time,
PVC showed substantial quotation divergence, and battery-related materials such as
Lithium Carbonate remained under pressure, highlighting increasingly selective price transmission across downstream chemical markets.
Carbon Black recorded the strongest daily price movement across all tracked markets, surging
18.93% to 11,757 CNY/ton. The rally was primarily linked to a sharp increase in
coal tar feedstock costs and tighter availability in the upstream tar market. Weekly and monthly gains of
14.23% and
16.67% confirm that the move is not limited to a single-day adjustment. However, elevated prices are beginning to weigh on downstream procurement, increasing the risk of weaker transaction volumes if the cost surge continues.
One of the tracked PVC price series experienced an exceptionally sharp
12.57% daily decline, falling from 5,650 to 4,940 CNY/ton. The move stands out from the broader PVC market, where the other tracked series remained comparatively firm. This divergence indicates that
quotation basis, product grade, market source or benchmark methodology may be contributing to the unusually large adjustment. Despite the daily drop, this series remains
7.52% higher on a monthly basis, suggesting that the latest decline should be treated as a sharp correction rather than evidence of a confirmed long-term downtrend.
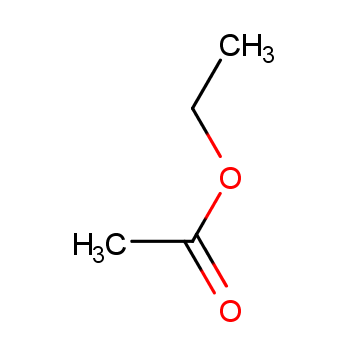
Ethyl acetate posted the third-largest daily move, rising
11.50% to 6,717 CNY/ton. The sharp increase reflects strengthening conditions across the
acetate solvent chain, with upstream acetic acid costs remaining elevated and spot availability becoming tighter. The product has also gained
6.77% over the past week and
6.34% over the past month, indicating that the latest jump is part of an established upward trend rather than an isolated price fluctuation.
Price increased 11.50% today — Elevated spot prices may encourage buyers to secure near-term requirements while monitoring downstream demand elasticity.
Basic chemicals showed a distinctly firm tone on September 11, but the strength was concentrated in several interconnected value chains rather than being a broad-based recovery in downstream demand. The strongest daily gains were recorded in
Ethyl acetate (+11.50%), Acetonitrile (+7.83%), PX (+6.67%), Acetone (+6.21%), Copper sulfate (+6.21%) and Isopropyl alcohol (+5.14%). At the same time,
Lithium carbonate (-4.26%), Ammonium sulfate (-4.04%) and Cobalt (-3.64%) moved lower, highlighting a clear divergence between oil-linked/basic petrochemicals and battery-related or fertilizer-related materials. The overall market therefore remained firm, but the underlying drivers were increasingly product-specific, with supply tightness, feedstock transmission and short-term procurement behavior playing a larger role than generalized demand expansion.
The acetyl chain was one of the strongest areas of the market. Acetic acid increased 2.63% day-on-day to CNY 3,903/ton, while Acetic anhydride rose 3.83% to CNY 6,363/ton. Their monthly gains reached 16.06% and 12.52%, respectively, indicating that the recent strength is not merely a one-day movement. The most aggressive move occurred further downstream in
Ethyl acetate, which surged 11.50% to CNY 6,717/ton. The simultaneous rise across Acetic acid, Acetic anhydride and Ethyl acetate points to a relatively strong transmission through the acetyl value chain. In particular, the sharp move in Ethyl acetate suggests that spot availability and supplier pricing behavior have become more important in determining near-term prices. Rather than indicating a uniform improvement in end-user demand, the current structure is more consistent with a market in which higher upstream replacement costs and limited spot availability are encouraging buyers to secure material earlier.
The phenol-ketone and solvent complex also strengthened sharply. Acetone rose 6.21% to CNY 9,400/ton, extending its weekly gain to 16.03% and its monthly increase to 22.42%, while Phenol increased 4.62% to CNY 9,625/ton. The simultaneous movement of these two products is particularly important because Phenol and Acetone are co-products within the phenol-ketone chain. The continued strength in both products therefore suggests that the market is being influenced by supply-side conditions across the chain rather than by isolated demand for a single solvent.
Isopropyl alcohol also increased 5.14% to CNY 9,533/ton, with its weekly gain reaching 10.50%, adding further evidence that solvent prices are responding to firmer feedstock economics and tighter spot conditions. With Acetone already more than 22% higher than a month earlier, the market is entering a relatively elevated price zone, increasing the likelihood that downstream buyers will become increasingly sensitive to margins.
The aromatics chain remained another major source of upward momentum. Benzene increased 0.68% to CNY 9,834/ton, while Toluene and Xylene rose 4.13% and 4.01%, respectively. More importantly, the cumulative gains were substantial: Benzene was up 10.23% week-on-week and 16.57% month-on-month, while Toluene and Xylene were up 18.01% and 19.85% on a monthly basis.
PX advanced another 6.67% to CNY 9,600/ton. The synchronized strength across Benzene, Toluene, Xylene and PX indicates that the movement is occurring across the broader aromatics complex rather than being limited to a single product. Tight spot availability, elevated replacement costs and higher upstream feedstock valuations are likely reinforcing the upward price structure. However, the magnitude of the monthly increases also means that further gains increasingly depend on whether downstream polyester and other derivative demand can absorb the higher cost base.
The olefin and glycol complex remained firm, although daily gains were more moderate. Propylene increased 0.17% to CNY 10,051/ton, while Propane rose 5.69% to CNY 6,500/ton. Propylene glycol gained 3.02% to CNY 9,822/ton, and Ethylene glycol increased 0.50% to CNY 6,625/ton. The most notable feature is the cumulative performance of Ethylene glycol, which has risen 21.26% over the past month. This suggests that the current market strength has developed over several weeks rather than being driven by a single session. Nevertheless, the relatively small daily movements in Propylene and Ethylene glycol compared with Acetone, Ethyl acetate and PX indicate that some downstream segments are beginning to show greater resistance to higher prices. Further upside may therefore depend increasingly on actual replenishment demand and operating rates rather than cost support alone.
Inorganic chemicals were more mixed. Hydrogen peroxide rose 2.58% to CNY 677/ton, Hydrochloric acid increased 1.08% to CNY 188/ton, and Borax gained 3.95% to CNY 6,320/ton. Calcium carbide also edged higher by 0.75%, while Sodium hydroxide remained broadly stable at CNY 2,523/ton. By contrast,
Ammonium sulfate fell 4.04% to CNY 1,187/ton despite remaining 5.94% higher on a weekly basis. This divergence suggests that the inorganic segment is being driven more by individual supply-demand balances and agricultural/industrial procurement cycles than by a common cost factor. Sulfur was also relatively weak on a monthly basis, down 9.03%, despite a small 0.76% daily increase, indicating that the upstream cost structure remains uneven across different inorganic chains.
Battery-related chemicals and metals moved in the opposite direction. Lithium carbonate declined 4.26% to CNY 135,000/ton, extending its weekly loss to 8.72%, while Cobalt fell 3.64% to CNY 282,900/ton and Nickel decreased 1.42% to CNY 127,583/ton. The lithium market in particular is showing a two-sided supply-demand structure. Recent market assessments indicate that downstream buyers continue to show interest around the CNY 140,000/ton level, while September lithium chemical supply is expected to increase, creating resistance to further price gains. At the same time, Chinese lithium chemical inventories declined by 2.8% month-on-month in August, suggesting that the market is not simply characterized by excessive inventories. The current decline therefore appears to reflect a combination of increased near-term supply expectations, cautious downstream purchasing and profit-taking following the earlier rally, rather than a complete deterioration in the underlying lithium market.
Methanol was another notable exception to the broader strength. Methanol declined 1.07% to CNY 3,687/ton, although it remained 10.10% higher on a weekly basis and 26.70% higher on a monthly basis. The large monthly increase combined with the latest daily correction suggests that the market has entered a period of consolidation after a strong previous rally. This pattern is important for the wider chemical complex because Methanol is an important feedstock for several downstream products, and a sustained correction in Methanol could eventually reduce cost pressure on selected derivatives. For now, however, its monthly performance remains sufficiently strong to indicate that the broader cost structure is still materially higher than one month ago.
Overall,
the September 11 Basic Chemicals market was characterized by strong internal differentiation rather than a uniform bullish trend. The strongest momentum was concentrated in the
acetyl, phenol-ketone, solvent and aromatics chains, where multiple connected products advanced simultaneously. Ethyl acetate recorded the largest daily increase at 11.50%, while Acetone, Acetonitrile, PX, Toluene and Xylene also posted substantial gains. At the same time, Lithium carbonate, Cobalt, Nickel and Ammonium sulfate moved lower, demonstrating that individual supply-demand conditions remain more important than a simple “commodity inflation” narrative. Looking ahead, the key issue for Basic Chemicals will be whether the recent increases can be validated by downstream replenishment. Products with strong monthly gains but relatively limited daily increases may increasingly encounter margin resistance, while products with simultaneous daily and weekly gains and tightening spot availability could retain stronger momentum. The near-term market therefore remains structurally firm, but
volatility and divergence between individual chemical chains are likely to remain high.
Fine chemicals showed a highly divergent market structure on September 11, with the three tracked products moving in completely different directions.
Trichloroethylene surged 10.71% day-on-day to CNY 5,044/ton, becoming the strongest performer in the segment, while
Cyanuric acid plunged 11.11% to CNY 6,800/ton, recording the largest decline. Sodium metabisulfite was comparatively stable, edging down only 0.25% to CNY 3,957/ton. The divergence is particularly notable because none of the three products showed a strong uniform weekly trend: Trichloroethylene was only 0.09% higher week-on-week, while Cyanuric acid and Sodium metabisulfite were down 1.61% and 0.48%, respectively. This indicates that the sharp daily movements were driven primarily by product-specific spot market conditions rather than a broad-based change in Fine Chemicals demand. Supply availability, producer pricing, inventory positions and individual downstream procurement cycles are therefore more important than a generalized chemical cost narrative in explaining the current market.
Trichloroethylene was the clear market leader. The price increased from CNY 4,556/ton on September 10 to CNY 5,044/ton on September 11, representing a sharp 10.71% daily increase. Despite the strong one-day move, its weekly change remained only +0.09% and its monthly change was still -0.98%, indicating that the latest rally should be viewed as a short-term repricing event rather than the continuation of an established monthly uptrend. Available market data showed that China's domestic Trichloroethylene price was around CNY 4,800/ton on September 10, with regional prices ranging from approximately CNY 4,190 to CNY 5,900/ton, highlighting considerable regional dispersion in spot quotations. The broad price range suggests that local supply availability, producer inventories and transaction conditions are playing an important role in determining actual market prices. Trichloroethylene is primarily used as an industrial solvent, particularly in metal cleaning and degreasing applications, and therefore its demand is closely linked to industrial manufacturing activity rather than mass consumer demand. The recent price jump is consequently more consistent with a tightening in prompt availability and a rapid adjustment in supplier quotations than with a sudden structural recovery in end-user consumption.
The key issue for Trichloroethylene is whether the latest price increase can be sustained. The fact that the product remains 0.98% lower on a monthly basis despite a 10.71% daily increase is significant. It suggests that the market has not yet established a persistent bullish trend. Instead, the September 11 move may represent a correction from a previously weaker price base, potentially amplified by differences between regional spot availability and producer offers. Earlier 2026 market assessments also identified higher feedstock costs as an important factor behind the rise in Chinese Trichloroethylene prices, while China's exports increased materially at the beginning of the year, indicating that the product remains closely connected to both domestic industrial demand and international trade flows. Going forward, the key indicators will be producer operating rates, regional inventory levels, export orders and downstream metal-processing demand. If the higher quotations are accompanied by actual transaction growth, the rally could develop into a more durable recovery; otherwise, the large one-day increase could be vulnerable to partial correction.
Cyanuric acid moved sharply in the opposite direction. The price fell from CNY 7,650/ton to CNY 6,800/ton, representing an 11.11% one-day decline. This was by far the largest downward movement among the three Fine Chemicals products. More importantly, the weekly and monthly declines were comparatively moderate at 1.61% and 5.50%, respectively. The large gap between the daily decline and the relatively limited cumulative losses suggests that the September 11 movement was likely a sharp spot-market adjustment rather than evidence of a long-established structural downturn. Cyanuric acid is closely connected with the water-treatment and chlorinated disinfectant chain, including applications related to swimming-pool treatment and other sanitation uses. Industry reports continue to identify water treatment and hygiene requirements as important long-term demand drivers for cyanuric acid and its downstream derivatives. However, short-term prices can be much more sensitive to export orders, distributor inventories and producer willingness to accept lower offers. The latest sharp correction therefore warrants close monitoring of transaction volumes and supplier quotations before interpreting it as a fundamental deterioration in end-user demand.
The Cyanuric acid market also needs to be viewed through its downstream chlorinated-isocyanurate chain. Cyanuric acid is an important intermediate for products such as chlorinated isocyanurate disinfectants, meaning that changes in downstream demand can influence purchasing behavior even when the underlying end-use market remains structurally healthy. Recent market research continues to identify municipal water treatment, swimming pools, industrial disinfection and tightening water-quality standards as important long-term demand drivers for chlorinated isocyanurate products. At the same time, the supply base for these products remains concentrated in Asia, particularly China and India, making export orders and regional logistics important determinants of short-term market balance. Therefore, the 11.11% decline in Cyanuric acid should currently be interpreted as a
short-term market correction with an uncertain fundamental trigger, rather than automatically being attributed to a collapse in water-treatment demand. The next few trading sessions will be important in determining whether the price stabilizes around CNY 6,800/ton or continues to move lower.
Sodium metabisulfite remained largely stable, making it the least volatile product in the Fine Chemicals basket. The price slipped only 0.25% to CNY 3,957/ton, while the weekly and monthly changes were -0.48% and -0.55%, respectively. This near-flat performance indicates that the market is currently close to balance, with neither supply tightening nor demand expansion strong enough to generate a significant price trend. Earlier September market assessments showed that domestic industrial-grade Sodium metabisulfite prices had already weakened from around CNY 3,996/ton at the beginning of the week to approximately CNY 3,970/ton at the end of the week, with weaker raw-material cost support identified as an important factor. This suggests that the current market is being constrained primarily by the cost side and relatively ordinary downstream purchasing rather than by a severe supply shortage. Sodium metabisulfite is widely used in water treatment, food processing, mineral flotation and other industrial applications, providing a diversified demand base, but its broad application range also means that individual downstream sectors may not generate enough incremental demand to drive a sustained price rally.
The contrast between Trichloroethylene and Sodium metabisulfite is particularly useful for assessing the current Fine Chemicals market. Trichloroethylene experienced a sudden 10.71% repricing despite having almost no weekly increase, whereas Sodium metabisulfite remained virtually unchanged across daily, weekly and monthly periods. This indicates that Fine Chemicals are currently being driven by highly localized supply-demand balances rather than a common macro trend. For products with relatively concentrated production capacity and limited spot availability, even a small change in producer inventories or purchasing activity can result in substantial daily price adjustments. By contrast, products with broader supply and diversified downstream demand are more likely to remain range-bound. This distinction is important because it means that daily price volatility in Fine Chemicals should not automatically be extrapolated into a medium-term trend.
Overall,
the September 11 Fine Chemicals market was characterized by extreme product-level divergence rather than a unified directional trend. Trichloroethylene recorded the strongest performance with a 10.71% daily increase, but its nearly flat weekly performance and still-negative monthly change indicate that confirmation of a sustained uptrend is still needed. Cyanuric acid experienced an equally notable 11.11% decline, although its weekly and monthly losses remain substantially smaller than the single-day move, suggesting a potential spot-market correction rather than a confirmed structural downturn. Sodium metabisulfite, meanwhile, remained essentially stable, with its monthly change limited to -0.55%. The immediate focus for Fine Chemicals should therefore remain on
producer operating rates, spot availability, inventory levels, export orders and downstream procurement rather than broad commodity-price movements. Among the three products, Trichloroethylene currently deserves the closest monitoring because of the unusually large daily repricing, while Cyanuric acid requires confirmation of whether the sharp decline represents a temporary adjustment or the beginning of a broader downward cycle.
Energy, Rubber, Plastic and other chemicals Prices
Energy, Plastics and Rubber markets showed a broadly firm tone on September 11, but the degree of price transmission varied significantly across individual value chains.
WTI crude oil rose 6.25% to USD 102/barrel, while Gasoline increased 2.00% and Asphalt advanced 4.62%, reflecting continued strength in the energy complex. In Rubber,
Carbon Black surged 18.93%, by far the strongest move among the three sectors, driven primarily by sharply higher coal tar costs and tightening supply rather than crude oil alone. Plastics remained mixed: ABS was nearly unchanged on the day but remained 13.89% higher on a monthly basis, POE gained 1.23%, while PVC showed substantial divergence between the two reported price series. Meanwhile, Anthracite fell 10.00% and Kerosene declined 2.38%, demonstrating that the current energy rally is not being transmitted uniformly across all fuel and solid-energy products. Overall, the market is characterized by strong upstream cost inflation, but downstream price transmission remains highly dependent on individual feedstock structures, inventories and purchasing behavior.
Energy remained the strongest macro driver, with WTI crude oil breaking decisively above the USD 100/barrel level. WTI increased from USD 96/barrel on September 10 to USD 102/barrel on September 11, representing a 6.25% daily increase, while its weekly and monthly gains reached 8.99% and 14.63%, respectively. The rally was driven by continued disruption risks in the Middle East, particularly around the Strait of Hormuz and regional shipping routes. On September 11, international oil prices remained on track for a weekly gain of more than 8%, while the IEA warned that global oil supply in 2026 could decline by approximately 5.7 million barrels per day as Gulf disruptions persisted. The combination of physical supply risks, higher freight costs and reduced regional refining availability has therefore created a strong cost floor for the broader energy complex. However, the latest market structure also shows that the transmission from crude into refined fuels is uneven, with individual products increasingly reflecting their own supply-demand balances.
Gasoline strengthened alongside crude oil, while Kerosene moved in the opposite direction. Gasoline increased 2.00% to CNY 10,241/ton, extending its weekly and monthly gains to 3.43% and 12.18%. The positive performance is consistent with the stronger crude-cost environment and tighter refined-product markets. Internationally, fuel markets have been particularly sensitive to disruptions in Middle Eastern shipping routes, with diesel prices also reaching extreme levels amid concerns over refinery and logistics constraints. By contrast,
Kerosene declined 2.38% to CNY 8,200/ton and remained essentially flat on a weekly basis, with a monthly decline of 0.19%. The divergence indicates that higher crude prices are not automatically translating into parallel gains across all refined products. Refinery yields, inventories, aviation-fuel demand and product-specific trade flows can materially alter the direction of individual fuel markets. This distinction is important for assessing the downstream impact on plastics and rubber, because the relevant cost transmission depends more on specific petrochemical feedstocks than on crude oil alone.
Asphalt continued to reflect strong energy and infrastructure-related cost support. The price increased 4.62% to CNY 5,848/ton, bringing its weekly gain to 8.20% and its monthly increase to 21.57%. Unlike gasoline, Asphalt is influenced not only by crude oil and refinery economics but also by domestic infrastructure activity, refinery production patterns and the availability of asphalt feedstocks. The combination of a higher crude-cost base and stronger monthly momentum suggests that the current asphalt rally has become more established than the latest one-day movement alone would imply. However, the 21.57% monthly increase also raises the possibility of downstream margin pressure, particularly if infrastructure-related demand does not accelerate at the same pace as the raw-material cost increase. Near-term market direction will therefore depend on the balance between refinery supply and actual road-construction and infrastructure procurement.
Anthracite diverged sharply from the broader energy complex. The price fell 10.00% from CNY 1,750/ton to CNY 1,575/ton, while its weekly and monthly changes remained -0.72% and -1.24%, respectively. This is a significant contrast with WTI crude oil, which was simultaneously rising strongly. The divergence reflects the fundamentally different pricing mechanisms of domestic coal and internationally traded crude oil. Anthracite prices are more directly influenced by domestic mine output, inventories, transportation conditions, steel and chemical demand, and regional supply-demand balances. The sharp one-day decline therefore appears to represent a domestic coal-market adjustment rather than a contradiction of the global energy rally. The relatively limited weekly and monthly losses also suggest that the latest move should be monitored for confirmation before being interpreted as the beginning of a sustained bearish cycle.
Rubber materials experienced the strongest cost inflation, led by Carbon Black. Carbon Black surged 18.93% to CNY 11,757/ton, with weekly and monthly gains reaching 14.23% and 16.67%, respectively. The scale and consistency of the increase distinguish Carbon Black from most other products in the dataset. Recent market information indicates that China's Carbon Black market moved from relatively stable pricing earlier in the week to a sharp increase later in the week, with regional prices reaching approximately CNY 11,500/ton in Shandong and CNY 11,800/ton in Guangzhou. The immediate driver was a significant increase in
coal tar prices, which had reached record levels amid tighter supply and firm demand. Anthracene oil prices also strengthened, further increasing the production cost of Carbon Black. This means that the current Carbon Black rally should not be attributed simply to higher crude oil prices: its direct feedstock relationship with coal tar is much more important.
The key risk for Carbon Black is increasingly shifting from cost support to downstream price acceptance. While coal tar and other feedstock costs are providing strong support, recent market reports indicate that downstream buyers have become more cautious after the sharp increase in Carbon Black prices. Procurement and transaction activity have slowed as tire manufacturers and other rubber-product producers face higher raw-material costs. Carbon Black operating rates also remain relatively moderate in some regions, meaning that higher prices have not necessarily translated into stronger producer profitability. This creates an important tension in the market: the cost floor remains high, but downstream buyers may resist further price increases. If coal tar prices remain elevated while tire demand remains stable, Carbon Black prices could retain a firm bias; however, if downstream purchasing weakens materially, the market could shift from aggressive repricing toward consolidation. The next stage of the rally will therefore depend heavily on whether higher spot quotations can be converted into actual transaction volumes.
Silica remained comparatively stable within the Rubber segment. The price of Silica declined only 0.54% to CNY 6,067/ton, leaving its weekly change almost flat at -0.08% and its monthly gain at 1.45%. The contrast with Carbon Black is significant because both materials are important reinforcing fillers used in rubber applications, yet their feedstock structures and market balances are different. Carbon Black is currently experiencing a pronounced coal-tar-driven cost shock, while Silica has not experienced the same degree of upstream pressure. The divergence suggests that the current increase in tire and rubber-material costs is highly selective rather than uniform across all reinforcing materials. For downstream tire manufacturers, the sharp increase in Carbon Black therefore represents a much more immediate margin challenge than the relatively stable Silica market.
Plastics showed a more complicated response to the energy shock. ABS edged down only 0.15% to CNY 11,650/ton, but remained 4.68% higher on a weekly basis and 13.89% higher on a monthly basis. The relatively small daily correction after a substantial monthly increase suggests that ABS is currently consolidating at an elevated cost level rather than entering a clear bearish cycle. ABS pricing is influenced by several feedstocks, including styrene, acrylonitrile and butadiene, and recent market data shows active price movements in all three upstream chains. Styrene prices were reported to have strengthened in Asia on September 11, while domestic China market data continued to track changes in Styrene, Butadiene and ABS producer pricing. This provides a stronger explanation for the persistent monthly strength in ABS than crude oil alone. Nevertheless, the limited daily increase indicates that downstream buyers are becoming more selective as resin prices rise.
POE remained firm but lacked the momentum seen in Carbon Black and some commodity resins. POE increased 1.23% to CNY 16,500/ton, with weekly and monthly gains of only 0.31% and 0.18%, respectively. The relatively narrow cumulative price movement suggests that POE is currently in a stable-to-firm phase rather than experiencing a broad cost-driven rally. Unlike ABS and PVC, POE is a more specialized polymer with demand linked to applications such as photovoltaic encapsulation and high-performance materials. Its price behavior therefore depends more strongly on specific downstream order conditions and producer availability than on crude oil alone. The latest 1.23% daily increase should consequently be treated as a modest strengthening signal, but not yet as confirmation of a new sustained uptrend.
PVC was the most unusual segment within Plastics because the reported price series showed a substantial divergence. One PVC series declined 12.57% to CNY 4,940/ton, generating a weekly loss of 21.77%, while the other PVC series fell only 0.81% to CNY 4,870/ton and remained 4.21% higher on a weekly basis. Because the two records have different identifiers in the supplied dataset, they should not be treated as directly interchangeable without confirming the underlying quotation methodology, grade, market basis or contract type. The sharper series is clearly undergoing a significant correction, whereas the second series remains within a broader firm monthly trend, with a 9.23% monthly increase. Therefore, the appropriate interpretation at this stage is not that “PVC prices collapsed” across the entire market, but rather that
specific PVC price benchmarks or grades experienced a sharp repricing while other PVC references remained comparatively resilient. This distinction is important and should be retained in the daily report until the two series can be mapped to their exact market definitions.
The relationship between energy prices and plastics therefore remains highly selective. WTI has risen 14.63% over the past month, but the plastics basket has not moved uniformly in the same direction. ABS has gained 13.89% monthly, PVC has risen 9.23% in one reported series, while POE is up only 0.18% and EAA is essentially unchanged at -0.01%. This suggests that crude oil inflation is being filtered through different feedstock and supply chains before reaching finished polymers. For ABS, the relevant transmission mechanism runs through styrene, butadiene and acrylonitrile; for PVC, the key balance is more closely related to chlorine/caustic soda, carbide or ethylene routes and domestic supply; while POE and EAA are more specialized materials with more concentrated demand and supply structures. Consequently, higher crude prices should be viewed as a supportive macro factor, but not as a sufficient explanation for the individual price movements.
EAA remained almost unchanged, reinforcing the contrast between commodity and specialty plastics. EAA increased only 0.17% to CNY 58,500/ton, with a weekly gain of 0.04% and a monthly decline of 0.01%. The near-flat performance indicates that the current energy and feedstock shock has not translated into meaningful price pressure in this market. EAA is a specialty copolymer whose pricing is more strongly influenced by producer capacity, application-specific demand and contract structures than by spot movements in crude oil. The stable price therefore provides a useful counterexample to the broader energy-led inflation narrative: even when upstream commodity markets experience substantial volatility, specialty polymers may remain relatively insulated when supply and demand are balanced.
Overall,
the September 11 Energy, Plastics and Rubber markets were characterized by strong upstream inflation but uneven downstream transmission. WTI crude oil rose 6.25% on the day and 14.63% over the month, while Gasoline and Asphalt also strengthened. However, the most significant downstream price shock came from
Carbon Black, which surged 18.93% as coal tar costs and supply tightness intensified. This move is particularly important for the Rubber industry because downstream tire producers are now facing a substantial increase in reinforcing-material costs, while their willingness to accept additional price increases is becoming more limited. In Plastics, ABS retained a strong monthly gain, while POE and EAA remained relatively stable and PVC displayed substantial benchmark-level divergence. Anthracite and Kerosene also moved lower despite the broader energy rally, confirming that the current market cannot be described simply as a generalized commodity inflation cycle. The key theme going forward is therefore
selective cost transmission: energy and feedstock inflation will continue to support prices, but the ultimate direction of Plastics and Rubber products will depend on specific feedstock availability, producer operating rates, inventories and downstream purchasing power.
Data Source & Update Methodology
The above pricing data is compiled from multiple market channels including domestic ex-works quotations, distributor transaction references, port prices, and mainstream spot market assessments. Data was updated on
September 11, 2026, based on the latest available trading activity and real-time market feedback collected by GuideTrends analysts and industry participants.
All prices are for reference purposes only and may vary depending on region, transaction volume, specification, and contract terms.
Explore More Chemical Price Data
Access Real-Time Chemical Market Intelligence
For real-time price updates, historical trend analysis, and detailed market insights covering thousands of chemical products, visit the
GuideTrends Database .
Track chemical prices, compare product specifications, monitor supply chain movements, and identify sourcing opportunities with professional market intelligence tools designed for global chemical buyers and suppliers.



 EN
EN
 Agricultural News
 Food News
 Industrial News
 Cosmetic News
 Pharmaceutical News
 Science News

 1YR
1YR


