Daily Chemical Market Price Overview — September 4, 2026
The latest daily chemical price update highlights increasingly differentiated market conditions across
Basic Chemicals,
Fine Chemicals,
Energy,
Plastics,
Rubber, and
Other Chemicals. Energy markets remained firm as higher crude oil prices and renewed supply-side risks supported downstream products, while selected basic and fine chemicals benefited from tight spot availability, producer maintenance, and replenishment demand. At the same time, several products recorded sharp corrections, indicating that downstream purchasing remains selective rather than broadly expansionary.
Market focus today centered on the continued strength of
Methanol,
Ethylene glycol,
Dimethyl carbonate,
ABS,
PVC, and
Carbon Black, supported by a combination of supply constraints and higher energy or feedstock costs. Meanwhile,
Potassium sorbate recorded an exceptional daily increase, while
Sodium dodecyl sulfate and
Poly(ethylene glycol) experienced significant declines, highlighting pronounced product-level volatility. Overall, the market remains supported by supply-side factors and elevated energy costs, but uneven downstream demand and high price levels are limiting the breadth of the rally.

Top Price Movers
Potassium sorbate recorded the strongest daily price increase across the four markets, rising from CNY 15,100/TON to CNY 20,000/TON. The sharp move was accompanied by weekly and monthly gains of 19.37% and 8.83%, indicating a significant short-term repricing rather than a broad-based market rally. The magnitude of the increase suggests that product-specific factors, such as producer quotations, spot availability, or short-term replenishment activity, may have played a major role. However, the available information does not yet provide sufficient direct evidence to confirm a specific supply disruption, so the move should be treated as a significant repricing signal requiring further verification.
Sodium dodecyl sulfate posted the largest daily decline among the listed products, falling from CNY 16,833/TON to CNY 14,850/TON. The weekly change of -2.16% suggests that the recent weakness is more consistent with short-term market adjustment than a prolonged downtrend. Although monthly prices remain 2.97% higher, the sharp daily decline indicates that previous gains may have encouraged more cautious purchasing or prompted a correction in spot quotations. The move highlights the importance of monitoring downstream demand and inventory conditions before interpreting the decline as a structural weakening of the market.
Poly(ethylene glycol) recorded the third-largest daily decline by absolute percentage change, falling from CNY 9,000/TON to CNY 8,000/TON. The weekly decline of -0.95% and monthly decline of -5.80% indicate that the product has been under pressure over a longer period, rather than experiencing only a single-day correction. The absence of a clear, directly verified news catalyst means the decline should not be attributed to a specific production disruption or demand shock. Instead, the data suggest that product-specific supply-demand conditions or quotation adjustments are currently outweighing any broader chemical-market cost support.
Price dropped 11.11% today — Monitor spot quotations and downstream replenishment before making sourcing decisions.
Basic Chemicals Prices
| Product |
CAS |
Price |
Daily |
Weekly |
Monthly |
| Acetic acid prices |
64-19-7 |
3,560 |
1.42% |
4.96% |
10.98% |
| Acetic anhydride prices |
108-24-7 |
5,815 |
0.87% |
3.81% |
8.17% |
| Acetone prices |
67-64-1 |
7,613 |
0.99% |
2.03% |
12.72% |
| Acetonitrile prices |
75-05-8 |
8,625 |
0% |
-0.19% |
-3.08% |
| Ammonium chloride prices |
12125-02-9 |
900 |
3.81% |
6.48% |
4.31% |
| Ammonium nitrate prices |
6484-52-2 |
4,150 |
0% |
0% |
0% |
| Ammonium sulfate prices |
7783-20-2 |
1,123 |
0.54% |
1.99% |
-0.35% |
| Aniline prices |
62-53-3 |
13,525 |
0% |
1.45% |
10.71% |
| Bauxite prices |
1318-16-7 |
700 |
0% |
0% |
0% |
| Benzene prices |
71-43-2 |
8,751 |
0.57% |
4.32% |
11.02% |
| Benzoic acid prices |
65-85-0 |
8,100 |
2.53% |
1.5% |
7.61% |
| Borax prices |
1303-96-4 |
6,160 |
0% |
2.08% |
6.27% |
| boric acid prices |
10043-35-3 |
11,525 |
0% |
2.63% |
3.8% |
| Butane prices |
106-97-8 |
6,700 |
0% |
-1.65% |
1.1% |
| calcium carbide prices |
75-20-7 |
2,550 |
0% |
1.12% |
3.84% |
| Calcium phosphate prices |
7758-87-4 |
10,000 |
0% |
0% |
0% |
| Caustic Soda prices |
68988-74-9 |
637 |
0% |
-0.31% |
-0.47% |
| Chloroform prices |
67-66-3 |
2,117 |
0% |
1.21% |
1.94% |
| Cobalt prices |
7440-48-4 |
305,300 |
0% |
-0.07% |
-5.24% |
| Copper sulfate prices |
7758-98-7 |
25,100 |
-3.37% |
-1.22% |
-0.58% |
| Dichloromethane prices |
75-09-2 |
2,263 |
1.34% |
-6.94% |
3.92% |
| distilled water prices |
- |
450 |
0% |
0% |
0% |
| Ethanol prices |
64-17-5 |
5,516 |
0% |
0.05% |
-0.52% |
| ethyl acetate prices |
141-78-6 |
5,782 |
-1.92% |
0.28% |
2.25% |
| Ethylene prices |
74-85-1 |
8,500 |
0% |
0% |
0% |
| Ethylene glycol prices |
107-21-1 |
6,370 |
2.05% |
5.85% |
17.39% |
| Ethylene Oxide prices |
75-21-8 |
8,300 |
5.06% |
1.97% |
5.26% |
| EVA prices |
- |
10,367 |
0% |
0% |
0.11% |
| Ferrous sulfate prices |
7720-78-7 |
500 |
0% |
0% |
0% |
| Formaldehyde prices |
50-00-0 |
1,535 |
1.45% |
6.21% |
15.92% |
| Formic acid prices |
64-18-6 |
2,200 |
0% |
5.01% |
13.28% |
| Glycerol prices |
56-81-5 |
9,800 |
3.16% |
0.77% |
0.47% |
| Heptane prices |
142-82-5 |
15,100 |
1.34% |
-0.95% |
-4.16% |
| Hexane prices |
110-54-3 |
8,850 |
0% |
0% |
1.89% |
| Hydrochloric acid prices |
7647-01-0 |
175 |
0% |
0% |
-3.85% |
| Hydrogen peroxide prices |
7722-84-1 |
637 |
2.25% |
1.63% |
4.66% |
| Iodine prices |
7553-56-2 |
640 |
0% |
0% |
0% |
| Iron prices |
7439-89-6 |
5,000 |
0% |
5.42% |
1.92% |
| Isopropyl alcohol prices |
67-63-0 |
7,967 |
2.8% |
0.01% |
2.51% |
| Kaolin prices |
1332-58-7 |
850 |
0% |
0% |
0% |
| Lithium carbonate prices |
554-13-2 |
150,000 |
-0.66% |
0.73% |
2.48% |
| Magnesium chloride prices |
7786-30-3 |
880 |
0% |
0% |
0% |
| Magnesium oxide prices |
1309-48-4 |
1,300 |
0% |
0% |
0% |
| Magnesium sulfate prices |
7487-88-9 |
1,000 |
0% |
0% |
-6.89% |
| Methanol prices |
67-56-1 |
3,356 |
0.21% |
12.47% |
20.88% |
| Mineral oil prices |
8042-47-5 |
72,000 |
0% |
-10.85% |
-1.91% |
| Nickel prices |
7440-02-0 |
129,117 |
-0.59% |
-0.84% |
-0.69% |
| Paraffin wax prices |
8002-74-2 |
9,800 |
0% |
0% |
0% |
| PET prices |
- |
8,259 |
-0.07% |
5.26% |
8.07% |
| Phenol prices |
108-95-2 |
8,455 |
0.06% |
1.77% |
1.12% |
| Phosphoric Acid prices |
7664-38-2 |
8,500 |
0% |
-0.51% |
-1.48% |
| Poly(vinyl alcohol) prices |
9002-89-5 |
10,400 |
0% |
0% |
0% |
| Potassium carbonate prices |
584-08-7 |
7,500 |
0% |
0% |
-0.11% |
| Potassium chloride prices |
7447-40-7 |
3,333 |
0% |
-1.45% |
-3.51% |
| Propane prices |
74-98-6 |
6,150 |
0% |
-1.13% |
-0.62% |
| Propylene prices |
115-07-1 |
9,368 |
-1.4% |
6.04% |
10.53% |
| Propylene glycol prices |
57-55-6 |
9,367 |
0% |
-2.42% |
-0.9% |
| PX prices |
- |
9,000 |
0% |
2.94% |
4.71% |
| Pyridine prices |
110-86-1 |
18,471 |
0% |
0.06% |
0.37% |
| Silicon prices |
7440-21-3 |
9,500 |
0% |
0.26% |
0.53% |
| Sodium bicarbonate prices |
144-55-8 |
1,208 |
-0.17% |
1.09% |
1% |
| Sodium carbonate prices |
497-19-8 |
1,260 |
0% |
0% |
0% |
| Sodium chloride prices |
7647-14-5 |
500 |
0% |
0% |
0% |
| Sodium fluoride prices |
7681-49-4 |
4,150 |
0% |
0.6% |
0.55% |
| Sodium hydroxide prices |
1310-73-2 |
2,500 |
0% |
0% |
0% |
| Sodium sulfate prices |
7757-82-6 |
560 |
0% |
0% |
0% |
| Sulfur prices |
7704-34-9 |
8,639 |
0.43% |
-5.16% |
-7.23% |
| Sulfur hexafluoride prices |
2551-62-4 |
28,100 |
0% |
0% |
0.05% |
| sulfuric acid prices |
7664-93-9 |
1,800 |
0% |
-1.1% |
-4.41% |
| Titanium dioxide prices |
13463-67-7 |
14,060 |
0% |
-0.85% |
-3.89% |
| Toluene prices |
108-88-3 |
7,843 |
-0.22% |
5.23% |
13.2% |
| Urea prices |
57-13-6 |
1,723 |
0.58% |
-0.17% |
-0.46% |
| White cement prices |
- |
450 |
0% |
0% |
0% |
| White phosphorus prices |
12185-10-3 |
28,029 |
-0.71% |
-0.12% |
0.78% |
| Xylene prices |
1330-20-7 |
8,133 |
-0.21% |
3.68% |
15.62% |
| Zinc chloride prices |
7646-85-7 |
11,825 |
0% |
0% |
0% |
| Zinc oxide prices |
1314-13-2 |
18,000 |
0% |
-8.14% |
6.8% |
| Zinc sulfate prices |
7733-02-0 |
5,500 |
0% |
0% |
0% |
Basic chemicals remained broadly firm, with
Acetic acid and
Acetic anhydride rising 1.42% and 0.87% daily, supported by low producer inventories and continued upward adjustments in regional offers. This supply-side tightness, together with higher upstream
Methanol costs, provided a clear cost-push explanation for the strength in both products.
Methanol itself edged up 0.21% daily and gained 12.47% weekly and 20.88% monthly, as falling port and producer inventories, limited import recovery, and planned maintenance supported the market. However, the restart of some maintenance units and weaker traditional downstream operating rates suggest that further upside may be more limited.
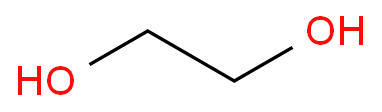
Ethylene glycol advanced 2.05% daily, 5.85% weekly, and 17.39% monthly, with concentrated plant maintenance, disrupted Middle Eastern imports, and low port inventories providing the main supply-side support. Nevertheless, declining polyester operating rates and weak downstream price transmission indicate that the market remains vulnerable to high-level consolidation. In contrast,
Ethyl acetate fell 1.92% daily despite continued support from higher upstream
Acetic acid prices, suggesting that cost support has not yet translated into stronger spot demand. Overall, the market remains driven more by supply tightness and cost support than by broad-based downstream demand, while recent gains in several products point to an increasingly cautious high-price environment.
Fine Chemicals Prices
| Product |
CAS |
Price |
Daily |
Weekly |
Monthly |
| Activated carbon prices |
64365-11-3 |
4,200 |
0% |
0% |
0% |
| Alkaline Phosphatase prices |
9001-78-9 |
20,000 |
0% |
0% |
0% |
| antifreeze prices |
- |
800 |
0% |
0% |
0% |
| azelaic acid prices |
123-99-9 |
80,000 |
0% |
0% |
0% |
| Benzyl alcohol prices |
100-51-6 |
18,500 |
0% |
0% |
0% |
| calcium acetate prices |
62-54-4 |
7,800 |
0% |
2.19% |
2.52% |
| Calcium carbonate prices |
471-34-1 |
500 |
0% |
-25.82% |
-22.48% |
| Castor oil prices |
8001-79-4 |
14,000 |
0% |
-0.36% |
-0.15% |
| chlorine tablets prices |
- |
8,500 |
0% |
0% |
0% |
| Citric acid prices |
77-92-9 |
6,200 |
0% |
0% |
0% |
| Cocamidopropyl betaine prices |
61789-40-0 |
6,000 |
0% |
0% |
0% |
| Creatine monohydrate prices |
6020-87-7 |
21,000 |
0% |
1.15% |
0.7% |
| Creatinine prices |
60-27-5 |
300,000 |
0% |
0% |
0% |
| Cyanuric acid prices |
108-80-5 |
7,650 |
0% |
-2.76% |
-4.73% |
| Diamond prices |
7782-40-3 |
110 |
0% |
0% |
0% |
| dimethyl carbonate prices |
616-38-6 |
5,683 |
5.24% |
8.83% |
20.06% |
| Dimethyl sulfoxide prices |
67-68-5 |
10,875 |
0% |
-3.49% |
-1.18% |
| Ferric chloride prices |
7705-08-0 |
2,800 |
0% |
0.9% |
0.86% |
| glycolic acid prices |
79-14-1 |
13,000 |
0% |
0% |
0% |
| Graphene Oxide prices |
2640657-49-2 |
110 |
0% |
0% |
0% |
| Guar gum prices |
9000-30-0 |
15,500 |
0% |
0% |
0% |
| Hydroquinone prices |
123-31-9 |
30,500 |
0% |
0% |
0% |
| Imidazole prices |
288-32-4 |
21,750 |
0% |
0.59% |
0.25% |
| Lactic acid prices |
50-21-5 |
8,113 |
0% |
0.31% |
0.3% |
| Lauric acid prices |
143-07-7 |
18,500 |
0% |
1.47% |
-0.32% |
| Magnesium glycinate prices |
14783-68-7 |
29,000 |
0% |
0% |
0% |
| Mannitol prices |
87-78-5 |
18,000 |
0% |
0% |
0% |
| Melamine prices |
108-78-1 |
6,213 |
0.21% |
0.62% |
-0.32% |
| Melatonin prices |
73-31-4 |
850 |
0% |
0% |
0% |
| Oleic acid prices |
112-80-1 |
10,000 |
0% |
3.27% |
2.76% |
| Petroleum prices |
8009-03-8 |
9,300 |
0% |
0% |
0% |
| Poly(ethylene glycol) prices |
25322-68-3 |
8,000 |
-11.11% |
-0.95% |
-5.8% |
| Potassium Citrate prices |
866-84-2 |
8,513 |
-8.1% |
-0.18% |
1.74% |
| Potassium iodide prices |
7681-11-0 |
45,000 |
0% |
0% |
0% |
| Potassium sorbate prices |
24634-61-5 |
20,000 |
32.45% |
19.37% |
8.83% |
| Quartz prices |
14808-60-7 |
6,800 |
0% |
0% |
0% |
| Silver iodide prices |
7783-96-2 |
1,804 |
0% |
-0.62% |
-19.61% |
| sodium acetate prices |
127-09-3 |
5,458 |
0.15% |
0.85% |
1.13% |
| Sodium benzoate prices |
532-32-1 |
850 |
0% |
0% |
0% |
| Sodium dodecyl sulfate prices |
151-21-3 |
14,850 |
-11.78% |
-2.16% |
2.97% |
| Sodium hypochlorite prices |
7681-52-9 |
553 |
0% |
0% |
0% |
| Sodium metabisulfite prices |
7681-57-4 |
3,970 |
-0.25% |
-0.22% |
-0.28% |
| Sodium polyacrylate prices |
9003-04-7 |
18,000 |
0% |
0% |
0% |
| Sodium thiosulfate prices |
7772-98-7 |
2,000 |
0% |
-2.63% |
4% |
| Sorbitol prices |
50-70-4 |
5,000 |
0% |
1.44% |
-2.53% |
| Stearic acid prices |
57-11-4 |
28,000 |
0% |
0% |
0% |
| Strontium oxide prices |
1314-11-0 |
8,500 |
0% |
0% |
0% |
| Tetrahydrofuran prices |
24979-97-3 |
17,167 |
0% |
0.16% |
-8.2% |
| tranexamic acid prices |
1197-18-8 |
330 |
0% |
0% |
0% |
| Trichloroacetic acid prices |
76-03-9 |
40,000 |
0% |
0% |
0% |
| Trichloroethylene prices |
79-01-6 |
4,567 |
-0.28% |
-4.29% |
-2.96% |
| Water softener salt prices |
- |
967 |
0% |
0% |
0% |
| Xanthan gum prices |
11138-66-2 |
21,000 |
0% |
0% |
0% |
Fine Chemicals showed a highly differentiated market, with most products remaining stable while a few supply-sensitive or short-term procurement-driven products experienced sharp price movements.
Dimethyl carbonate rose 5.24% daily, extending its weekly and monthly gains to 8.83% and 20.06%, respectively. Recent market information pointed to
reduced operating rates, production-unit maintenance, and firm demand from electrolyte-solvent applications as the main sources of support, suggesting that the current strength reflects more than a single-day rebound. In contrast,
Potassium citrate fell 8.10% daily despite a 1.74% monthly gain, indicating a short-term correction after earlier supply tightness and replenishment-driven increases rather than a confirmed reversal of the broader trend.
Poly(ethylene glycol) declined 11.11% daily and 5.80% monthly, while
Potassium sorbate surged 32.45% daily, making it the most notable price anomaly in the group. However, the available information does not yet provide sufficient direct evidence to attribute either move to a specific production disruption or demand shock, so these changes should be treated as
product-specific repricing signals requiring further verification. Meanwhile,
Citric acid,
Glycolic acid,
Hydroquinone,
Lactic acid,
Sodium acetate, and most other listed products remained unchanged, suggesting that downstream purchasing remained selective and that the market was not experiencing broad-based demand acceleration. Overall, the Fine Chemicals market continued to be driven more by
individual product supply conditions, inventory levels, and short-term procurement activity than by a uniform industry-wide trend. The near-term outlook therefore remains mixed: products with sustained supply-side support may continue to trade firmly, while products without a clear catalyst are more likely to remain range-bound or experience short-term corrections.
Energy, Rubber, Plastic and other chemicals Prices
| Product |
CAS |
Price |
Daily |
Weekly |
Monthly |
| ABS prices |
- |
11,100 |
0.15% |
5.6% |
11.52% |
| anaerobic bacteria prices |
- |
50 |
0% |
0% |
0% |
| Anthracite prices |
8029-10-5 |
1,750 |
11.11% |
-6.69% |
-0.35% |
| Asphalt prices |
8052-42-4 |
5,295 |
1.24% |
9.25% |
16.55% |
| Basalt prices |
- |
650 |
0% |
0% |
0% |
| Carbon prices |
7440-44-0 |
12,367 |
0.28% |
1.03% |
1.19% |
| Carbon Black prices |
1333-86-4 |
9,629 |
5.32% |
1.83% |
8.03% |
| Gasoline prices |
- |
9,756 |
-0.45% |
5.58% |
10.45% |
| HDPE prices |
- |
10,850 |
-0.8% |
1.96% |
3.28% |
| kerosene prices |
- |
8,200 |
0% |
0.33% |
-0.46% |
| Poly(vinyl acetate) prices |
9003-20-7 |
12 |
0% |
0% |
0% |
| POM prices |
- |
5,400 |
0% |
-16.36% |
-1.22% |
| PVC prices |
- |
4,820 |
3.21% |
6.83% |
7.06% |
| Silica prices |
10279-57-9 |
6,100 |
0% |
0.5% |
1.53% |
| WTI Crude Oil prices |
- |
91 |
0% |
4.76% |
9.76% |
Energy, Plastics, Rubber, and Other Chemicals showed a firm but highly differentiated market, with energy products leading the broader gains while plastics and rubber materials responded unevenly to higher costs and supply-side constraints. In the
Energy market,
WTI Crude Oil rose 4.76% weekly and 9.76% monthly, while
Gasoline gained 5.58% weekly and 10.45% monthly. Recent market reports linked the oil rally to
renewed U.S.-Iran tensions, risks to shipping through the Strait of Hormuz, and concerns over Middle East supply disruptions. This provided a clear cost and supply-risk explanation for the strength in
Asphalt, which rose 1.24% daily, 9.25% weekly, and 16.55% monthly. In
Plastics,
ABS remained strong, gaining 5.60% weekly and 11.52% monthly, while
PVC advanced 3.21% daily, 6.83% weekly, and 7.06% monthly. Recent PVC market data showed broad-based increases in regional spot prices, with Asian export quotations also rising, suggesting that
higher costs were being reinforced by tighter spot availability and improved export pricing. However,
HDPE fell 0.80% daily despite weekly and monthly gains of 1.96% and 3.28%, indicating that cost support has not translated into uniform short-term demand strength across all plastic products. In
Rubber,
Carbon Black rose 5.32% daily and 8.03% monthly, supported by
high coal-tar feedstock costs, environmental restrictions, maintenance-related supply reductions, and replenishment demand from tire manufacturers. This was a clearer supply-driven move than the broader plastics rally, while
Silica remained unchanged daily and gained only 1.53% monthly, highlighting the divergence within the rubber-material segment. In
Other Chemicals, most products remained stable, while
Anthracite surged 11.11% daily but remained down 6.69% weekly and 0.35% monthly, suggesting a short-term rebound rather than a confirmed upward trend. Overall, the market remained supported by
higher energy costs and selective supply-side tightening, but the divergence between products indicates that downstream demand and inventory conditions are still limiting the breadth of the rally. The near-term outlook therefore remains firm for supply-sensitive products such as
Asphalt, PVC, ABS, and Carbon Black, while products without clear supply or demand catalysts are more likely to remain range-bound or experience short-term corrections.
Data Source & Update Methodology
The above pricing data is compiled from multiple market channels including domestic ex-works quotations, distributor transaction references, port prices, and mainstream spot market assessments. Data was updated on
September 4, 2026, based on the latest available trading activity and real-time market feedback collected by GuideTrends analysts and industry participants.
All prices are for reference purposes only and may vary depending on region, transaction volume, specification, and contract terms.
Explore More Chemical Price Data
Access Real-Time Chemical Market Intelligence
For real-time price updates, historical trend analysis, and detailed market insights covering thousands of chemical products, visit the
GuideTrends Database .
Track chemical prices, compare product specifications, monitor supply chain movements, and identify sourcing opportunities with professional market intelligence tools designed for global chemical buyers and suppliers.


 EN
 Agricultural News
 Food News
 Industrial News
 Cosmetic News
 Pharmaceutical News
 Science News


 1YR

