Daily Chemical Market Price Overview for August 28, 2026: PVC surged 52.33%, Sorbitol rose 44.93%, while Kaolin fell 48.48%. Explore key price movers, market trends, supply-demand factors, and chemical industry developments.GuideView18 MIN READAugust 28, 2026
Daily Chemical Market Price Overview — August 28, 2026
The latest daily chemical price update highlights divergent movements across major sectors including
Basic Chemicals,
Fine Chemicals,
Energy,
Plastics, and
Rubber. While a large number of products remained stable, selected solvents, energy products, specialty chemicals, and polymers recorded notable short-term price movements. This report summarizes daily, weekly, and monthly price fluctuations to help manufacturers, traders, and procurement professionals track short-term volatility, supply-demand changes, cost pressures, and broader pricing trends across the chemical supply chain.
Market focus today centered on firmer
energy and selected chemical prices, with Gasoline, Kerosene, Methanol, Dimethyl carbonate, and Acetone showing upward momentum. Meanwhile, several fine chemicals and industrial materials experienced sharp corrections, while
PVC, Sorbitol, and Kaolin recorded exceptionally large daily movements that may partly reflect quotation, specification, or regional benchmark differences and therefore warrant additional verification. Overall, the market remains characterized by
selective cost-driven gains, uneven downstream demand, and significant product-level volatility.
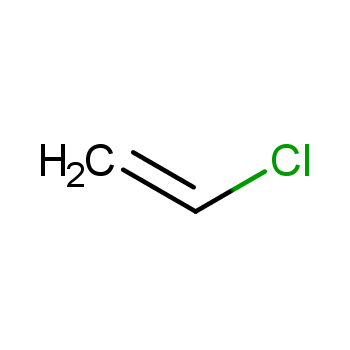
Polyvinyl chloride recorded the strongest daily increase in today’s dataset, rising 52.33% from CNY 4,300/ton to CNY 6,550/ton. However, the magnitude of the move is highly unusual and diverges sharply from the other PVC quotation in the same dataset, which increased only 1.30% to CNY 4,435/ton. Public market data around August 28 showed conventional PVC prices remaining close to the CNY 4,400/ton range rather than experiencing a broad-based 50% surge. The move should therefore be treated primarily as a
potential quotation, specification, regional, or data-source anomaly pending further verification.
Price jumped 52.33% today — Verify product specification and quotation source before interpreting the move as a market-wide PVC rally.
Sorbitol recorded the second-largest daily move, rising 44.93% to CNY 5,000/ton. The sharp increase contrasts with its weekly and monthly performance, which remained negative at -9.00% and -6.89%, respectively, indicating that the latest move is more likely to reflect
regional quotation changes, grade differences, or short-term repricing than a broad-based structural rally. Recent market quotations show substantial price differences between food-grade 70% sorbitol and higher-purity or solid grades, with reported regional prices ranging from roughly CNY 4,225 to CNY 7,200/ton.
Price jumped 44.93% today — Strong volatility, but specification and regional quotation differences should be checked before assessing underlying demand.
Kaolin recorded the largest daily decline, falling 48.48% from CNY 1,650/ton to CNY 850/ton. The magnitude of the decline is inconsistent with recent market quotations, which show industrial-grade kaolin around CNY 850/ton while other grades, including Hubei industrial grade and imported products, trade at substantially different levels. The sharp move therefore appears more likely to reflect a
change in benchmark specification or quotation source than a sudden collapse in the overall kaolin market. Demand from paper, ceramics, coatings, and other industrial applications remains the key underlying market factor.
Price dropped 48.48% today — Potential sourcing opportunity, but buyers should confirm grade, quality, and benchmark basis before acting.
Basic chemicals traded in a broadly mixed pattern, with sharp gains in
Butane,
Ammonium chloride, and
Methanol contrasting with corrections in
Propane,
Isopropyl alcohol, and
Dichloromethane. Butane rose 12.79% day-on-day, while Ammonium chloride gained 6.04%, indicating firmer conditions in selected gas and nitrogen-related markets.
Methanol increased 2.49% to CNY 2,922/ton, supported by stronger regional spot quotations and firmer futures sentiment, although the market remained highly differentiated between coastal and inland regions. Public market data showed East China and several southern regions strengthening on August 28, while some inland markets weakened, highlighting the importance of regional supply-demand differences. Meanwhile,
Acetone advanced 1.82% and remained up 8.72% weekly and 17.72% monthly, keeping the solvent market at a relatively elevated level despite recent fluctuations. In contrast,
Isopropyl alcohol and
Dichloromethane fell 4.97% and 4.82% respectively on the day, suggesting short-term profit-taking and inventory pressure after their earlier weekly gains.
Ethylene glycol also remained relatively firm, rising 0.92% daily and 6.72% weekly, in line with continued volatility across the polyester and olefin-related chain. In the energy and sulfur-related segment,
Sulfur declined 2.95% day-on-day, reflecting continued normalization after the sharp price fluctuations seen earlier in the year as geopolitical supply concerns eased.
Lithium carbonate, however, rose 2.00% to CNY 153,000/ton, while lithium-related market sentiment was supported by stronger expectations for the battery supply chain and improving earnings reported by major lithium producers. The most unusual movement was
Kaolin, which plunged 48.48% in a single day; given the magnitude of the decline, this move should be treated cautiously and verified against the underlying quotation source, product grade, and benchmark methodology before being interpreted as a fundamental market correction. Overall, the chemical market remains characterized by
regional supply-demand divergence, cost-driven volatility, and selective downstream restocking, with petrochemical solvents and methanol-related products showing stronger momentum while several inorganic and mature industrial chemicals continue to face weaker demand.
Fine chemicals showed a highly differentiated trading pattern, with most products remaining stable while several products posted unusually sharp daily movements.
Sorbitol surged 44.93% day-on-day to CNY 5,000/ton, while
Dimethyl carbonate (DMC) increased 5.01% to CNY 4,883/ton, extending its weekly and monthly gains to 4.92% and 13.63%, respectively. The DMC rally has been supported by tighter effective supply and resilient downstream demand, with market data showing the domestic price had risen to around CNY 4,883/ton by August 28 and gained more than 8% over five trading days.
Lauric acid also jumped 13.54% to CNY 14,533/ton, although its weekly and monthly performance remained negative, suggesting that the latest increase may partly reflect short-term replenishment and feedstock-related volatility. The broader fatty-acid chain continues to receive cost support from firmer vegetable oils, with the palm oil benchmark reaching CNY 9,722/ton on August 28, up 5.28% from the beginning of the month.
Trichloroethylene rose 12.09% to CNY 5,340/ton, reversing part of its recent weakness, while
Cyanuric acid gained 3.23% and remained up 4.56% on a monthly basis. In contrast,
Activated carbon fell 29.79%,
Sodium polyacrylate declined 18.37%, and
Calcium carbonate dropped 39.30% on a weekly basis, indicating continued pressure in selected water-treatment, mineral, and industrial additive markets. However, the sharp one-day decline in Activated carbon should be interpreted cautiously, as market quotations vary significantly by raw material, iodine value, particle size, regeneration status, and application grade; therefore, the reported move may partly reflect a change in quotation specification rather than a broad-based market collapse. Similarly, the exceptional daily increase in
Sorbitol should be treated with caution because recent market quotations show substantial regional and specification differences, with food-grade 70% prices ranging from around CNY 3,450 to CNY 5,000/ton within the latest reported period. Other products including
Citric acid,
Creatine monohydrate,
Dimethyl sulfoxide,
Hydroquinone,
Mannitol,
Potassium iodide, and
Xanthan gum remained largely unchanged, indicating limited broad-based repricing across the fine chemicals market. From a regulatory perspective, China's updated environmental management requirements for new chemicals took effect on August 15, with the authorities ending the previous new-chemical environmental filing process and requiring qualifying companies to submit environmental management registration applications before production or import. This policy is particularly relevant to
specialty chemicals, functional materials, and emerging fine-chemical products, as environmental compliance and registration requirements may increasingly influence commercialization timelines and supply availability. Overall, the fine chemicals market remains characterized by
selective price spikes, strong specification and regional differentiation, and increasingly important regulatory requirements, while the strongest near-term momentum is concentrated in DMC and selected lipid-based and specialty chemical products rather than across the entire sector.
Energy, Rubber, Plastic and other chemicals Prices
Energy, plastics, rubber, and other chemicals showed a mixed but generally firmer trend, with
Gasoline, Kerosene, Asphalt, Carbon Black, and ABS gaining while most other products remained stable. In the energy segment,
Gasoline increased 0.78% day-on-day and 9.44% on a monthly basis, while
Kerosene rose 2.44% to CNY 8,400/ton. The moves were supported by higher international crude prices and China's latest domestic refined-fuel price adjustment, with the National Development and Reform Commission raising standard gasoline and diesel prices by CNY 375/ton and CNY 360/ton respectively from midnight on August 28.
WTI crude oil was also recorded at USD 84/barrel in the dataset, up 2.44% day-on-day and 5.13% month-on-month. Although crude prices had weakened on August 28 amid expectations of a possible easing of tensions around the Strait of Hormuz and concerns over global monetary policy, renewed geopolitical escalation at the end of the month pushed WTI back above USD 84/barrel, keeping the energy cost outlook highly volatile.
Asphalt also strengthened to CNY 4,758/ton, rising 0.70% daily, 4.43% weekly, and 2.04% monthly, reflecting firmer energy costs and improving expectations for infrastructure-related demand. In plastics,
ABS remained relatively resilient, increasing 0.33% day-on-day and 4.48% month-on-month, while
HDPE gained 1.06% over the month. By contrast,
POM remained under significant pressure, with weekly and monthly declines of 13.37% and 20.97%, respectively, indicating weak downstream purchasing and continued pressure on engineering-plastics demand. The broader plastics market remains highly differentiated as China's manufacturing demand continues to face headwinds, with August manufacturing activity expected to remain below the 50-point expansion threshold. A major data anomaly appears in
PVC, where one quotation increased 52.33% in a single day from CNY 4,300/ton to CNY 6,550/ton, while another PVC benchmark in the same dataset increased only 1.30% to CNY 4,435/ton. Public market data showed the carbide-process SG-5 PVC benchmark at around CNY 4,378/ton on August 28 and indicated that domestic PVC prices had generally weakened during August, with spot trading remaining sluggish. Therefore, the 52.33% move should be treated as a potential
quotation, specification, regional, or data-source anomaly rather than interpreted as a broad-based PVC rally. In the rubber-related segment,
Carbon Black rose 1.76% daily and 3.46% weekly to CNY 9,071/ton, supported by higher energy and feedstock costs, while
Silica remained stable at CNY 6,067/ton. The combination of elevated crude prices and relatively firm downstream tire-related demand provided some cost support to carbon black, although broader manufacturing conditions remain mixed. Other chemicals were largely stable, with
Carbon unchanged at CNY 12,167/ton and
Basalt and anaerobic bacteria also showing no price movement. Overall, the market is characterized by
higher energy costs, selective cost-pass-through into plastics and rubber, and weak underlying industrial demand. Energy products currently provide the strongest upward momentum, while ABS and carbon black show relative resilience. Meanwhile, the sharp divergence between the two PVC quotations and the deep decline in POM highlight the importance of monitoring product grade, regional quotation methodology, and downstream purchasing activity when interpreting daily price movements.
Data Source & Update Methodology
The above pricing data is compiled from multiple market channels including domestic ex-works quotations, distributor transaction references, port prices, and mainstream spot market assessments. Data was updated on
August 28, 2026, based on the latest available trading activity and real-time market feedback collected by GuideTrends analysts and industry participants.
All prices are for reference purposes only and may vary depending on region, transaction volume, specification, and contract terms.
Explore More Chemical Price Data
Access Real-Time Chemical Market Intelligence
For real-time price updates, historical trend analysis, and detailed market insights covering thousands of chemical products, visit the
GuideTrends Database .
Track chemical prices, compare product specifications, monitor supply chain movements, and identify sourcing opportunities with professional market intelligence tools designed for global chemical buyers and suppliers.



 EN
EN
 Agricultural News
 Food News
 Industrial News
 Cosmetic News
 Pharmaceutical News
 Science News

 4YRS
4YRS

